
Chromatography
Building a Gas Chromatograph From Scratch? Now That’s Innovation.
Jun
Every once in a while, we come across a project that reminds us why we love the world of laboratory science.
Earlier this year, we heard from Bentley Day, a high school student taking on an ambitious challenge: building a DIY gas chromatograph to study volatile organic compound emissions from corn silage, a real air-quality concern in agricultural regions. Pretty cool, right? What stood out to us was the careful, methodical thinking behind it. Every choice, from carrier gas to column to detector design, directly shapes the accuracy of the results. Analytical science is as much about asking the right questions as finding the answers. Bentley needed a HayeSep Q packed column to make it work, and it was outside his budget. We were happy to donate a 6-foot column to help him along. Read his progress in his own words below:
Building a Gas Chromatograph to Study Silage Emissions
Welcome to my blog. This first installment outlines the research I’ve completed so far, although there hasn’t been much actual construction yet. I’ll be reporting progress on each of the action items listed below.
What I’m Trying to Accomplish
The goal of this science fair project is to measure the pollutants released by silage and use those measurements to recommend farming practices that reduce emissions.
Why Is This Important?
When silage ferments, it releases carbon dioxide along with a class of compounds called volatile organic compounds (VOCs), with ethanol being a common example. Once airborne, VOCs react with nitrogen oxides in the presence of sunlight to form ground-level ozone, a key component of smog and a serious air-quality problem in some agricultural regions. By measuring exactly which compounds silage releases, we can determine which storage and management practices produce the fewest emissions. In one sentence: we’re measuring the pollutants coming off silage with the goal of recommending practices that reduce them.
The Instrument: A Gas Chromatograph
The primary instrument for this project is a gas chromatograph (GC). A GC works by pushing a gas sample through a long column packed with a material that separates different compounds, and then sending those compounds past a detector one at a time. To build a working GC, I need to solve several problems:
- Should I use nitrogen or helium?
- How do I connect the gas supply and inject the sample?
- Which column should I use?
- How do I heat the column?
- Which detector should I build?
- Do I need a second column for reference?
- How do I get detector data into a Google Sheet?
- How do I interpret all the peaks in the graph?
Question #1: Nitrogen or Helium?
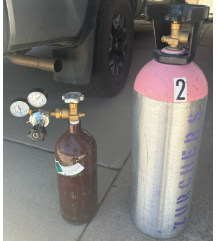
I have two empty gas tanks: a small argon tank used for welding, and a larger helium tank meant for party balloons. Nitrogen is inexpensive, while helium is not. Both should work, but helium provides better sensitivity. Do I actually need that extra sensitivity? I’m not sure. I’m leaning toward helium because a GC uses relatively small amounts, and the tank can later double as a balloon tank, so the added cost isn’t a big issue. Action item: Exchange the empty helium tank for a full one at a welding shop to get 99.9% helium, rather than diluted helium from a party store.
Question #2: Gas Connections and Sample Injection
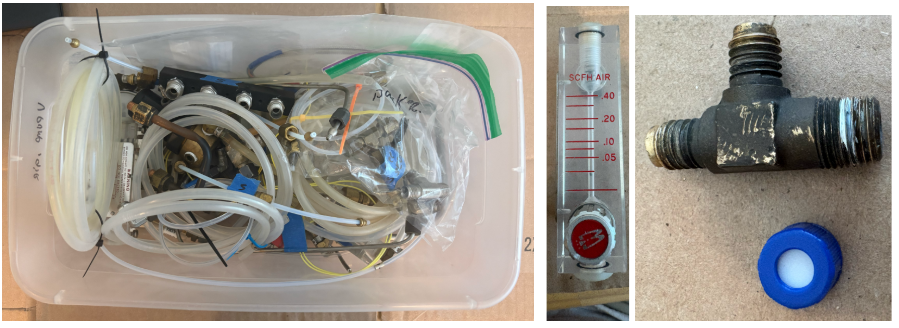
I was given a box of salvaged parts to work with, including two rotameters (for flow regulation) and a Swagelok tee for injecting samples. I learned that Swagelok and Parker fittings may look similar but are not interchangeable, and both are expensive. However, for low pressure and temperature, I can make a ferrule using Teflon tubing. Action item: Create a flow diagram and figure out how to assemble a working system from the available parts.
Question #3: Which Column to Use?
Modern GCs typically use capillary columns, but those are difficult to build. Packed columns are much easier for a DIY setup. I found references to using materials like detergent, kitty litter, and silica gel, but those aren’t suitable for silage VOCs. Better options include CarboWax and HayeSep Q. CarboWax struggles with humidity, which is a problem since silage gases are moist. That leaves HayeSep Q as the best option. Fortunately, I was given a 6-foot HayeSep Q column. Action item: Install the column once the flow hardware is ready.
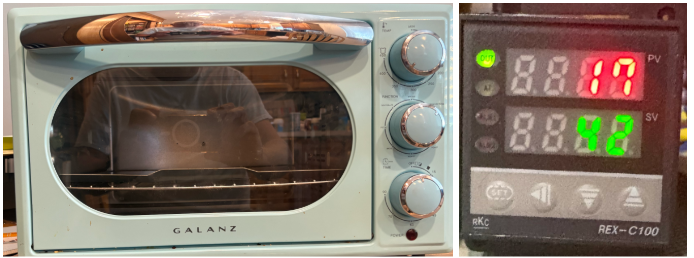
Question #4: How to Heat the Column
This part is straightforward. I’ll use a desktop convection oven and drill holes in the back for plumbing and wiring. The oven’s built-in timer will serve as a failsafe, and I’ll add an external thermocouple-based thermostat for precise control. I’ll leave the oven’s thermostat set to high as a backup safety limit. Action item:
- Install a solid-state relay with the heating element
- Add a thermocouple inside the oven
- Wire the external thermostat
- Drill access holes for plumbing and wiring
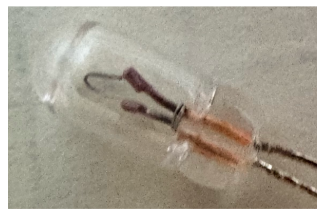
Question #5: Which Detector to Build?
Professional GCs often use flame ionization detectors (FID), but that’s too complex and involves handling hydrogen, which is not practical or safe for this setup. The only realistic option is a thermal conductivity detector (TCD). The idea is simple: use a small filament (like a grain-of-wheat bulb), remove the glass, and expose the filament to the gas flow. As gases pass over it, they change how it cools, which changes the electrical signal. Action items:
- Figure out how to place the filament in the gas stream
- Capture voltage changes using a Raspberry Pi Nano
Question #6: Do I Need a Second Column?
Professional systems often use a second column for reference. This helps cancel thermal drift and pressure noise using a bridge circuit. But do I actually need this? It adds complexity, and I might be able to handle drift in software. Action item: Start with a single column. If needed, add a reference column later.
Question #7: Data to Google Sheets
This part should be easy. I’ve done it before. A Wi-Fi microcontroller can collect data, send it to Google Sheets, and generate a graph. I’ll inject a sample, press a button, and collect around a thousand voltage samples. Using AI to generate the code should simplify this considerably. Action item: Adapt existing code to handle GC data.
Question #8: Interpreting the Peaks
Each compound travels through the column at a different speed, producing peaks at different times. By injecting known compounds (like ethanol, methanol, or acetic acid), I can identify when each appears. Then, when I see unknown peaks, I can estimate what they are by comparison.
Closing Thought
At this point, most of the work is still in planning and problem-solving. The next phase will be assembling hardware and seeing if this thing actually works.